

In Azure Virtual Desktop (AVD) environments, performance issues can arise due to a variety of factors, such as insufficient hardware resources or poorly optimized configurations. Troubleshooting these issues can be challenging, especially when dealing with large-scale deployments. In this blog post, we share a step-by-step guide on how to troubleshoot performance issues in AVD environments, with a specific focus on SQL Server-related performance issues. Whether you are a seasoned SQL Server Engineer or new to AVD environments, this guide will help you identify and resolve performance issues effectively.
Troubleshooting performance issues in virtual desktop environments is challenging. It requires a solid grasp of the deployment architecture and an understanding of how the various system components interact with each other. Poor or inconsistent performance is the single biggest reason for an end-user to be unhappy with their virtual desktop and is by far the most common reason for failures of virtual desktop projects.
In this article, we’ll explore a practical, methodical approach to identifying and resolving common performance issues that arise in Azure Virtual Desktop (AVD) environments deployed in Azure. This is not meant to be an exhaustive guide for every possible deployment scenario, but rather an easy-to-follow, practical approach. We will not use fancy monitoring and reporting tools and will leverage only free, built-in tools for performance monitoring such as the Task Manager, Resource Monitor, and Azure Monitor.
There are four likely areas that should be investigated when users report poor performance and this write-up will be organized in the following order:
Reproducible vs. Sporadic: Azure Virtual Desktop Performance Problems
Just like when you bring your car to a mechanic and the problem “goes away” by itself, pinning down performance problems can be difficult. However, understanding specifically what the user means by “it’s slow” and being able to reproduce it at will decreases the difficulty of performance troubleshooting by an order of magnitude.
For this discussion, let’s assume that performance issues are constant or reproducible. Once we have a good grasp on how to troubleshoot these “easier” problems we’ll be able to tackle the more challenging “sporadic” performance issues. The approach to troubleshooting reproducible issues is different from sporadic ones. When the issue is happening in real-time, we want to watch various real-time metrics and identify the one constraint that’s the bottleneck. When issues occur sporadically without a way to “make it happen” we have to rely on good quality reporting tools that can monitor many metrics at a granular level and help us correlate the occurrence of the issue with a historical view of the system metrics at that time.
There is never more than ONE constraint at a time
It is critical to remember that there is one, and only one, bottleneck that is constraining the system at any one time. The goal should be identifying that one constraint and eliminating it. Once that’s done, the bottleneck will shift elsewhere and that will become the new constraint of the system. It is very possible that as soon as the current constraint is alleviated, the system performance improves only marginally until the bottleneck shifts elsewhere but that doesn’t negate the fact that our focus should always be on finding the one bottleneck that’s constraining the system right now. Such focus will make our job significantly easier – solving for one variable – even if soon after we’ll have to solve for another.
Microsoft Azure Virtual Desktop Troubleshooting Tools
In this guide we are going to rely on a handful of free monitoring and troubleshooting tools.
- Task Manager – will be used to monitor and troubleshoot CPU-based system constraints
- Right-click task bar and select Task Manager OR
- Press CTRL-ALT-DEL and click on Task Manager OR
- From Run box or command prompt type taskmgr
- Resource Monitor – will be used to monitor and troubleshoot RAM and DISK related constraints
- From Task Manager>Performance tab click “Open Resource Monitor” link on the bottom left OR
- From Run box or command prompt type resmon
- Ping – will be used to monitor and troubleshoot NETWORK latency and packet loss
- PingPlotter – can be used to correlate packet loss and latency with poor user experience and determine where along the path the issue occurred
- PingPlotter Free can be downloaded here
- Speedtest.net – will be used to measure internet bandwidth on local connection and within virtual desktop session
- Iperf – can be used for advanced throughput measurement between two network nodes
- Iperf can be downloaded here
- Azure Monitor is a very powerful tool that can be used to monitor many different metrics for any Azure resource. Monitoring and graphing Standard Metrics available on Azure resources is free. Azure Monitor can be used to configure monitoring of CPU, RAM, DISK and NETWORK metrics on one or more Azure desktop VMs and use the data collected overtime to correlate user-reported performance issues with actual system behavior. It is a great way to figure out what’s causing sporadic performance issue if they cannot be easily reproduced and monitored with the other tools mentioned above.
- Azure Monitor can be accessed in the Azure Portal>Monitor
- Detailed information about the capabilities can be found here
Now that we understand the objective and have our tools in hand, we’re ready to begin the process of troubleshooting performance and implementing best practices.
1. AVD Environments: CPU-Related Performance Constraints
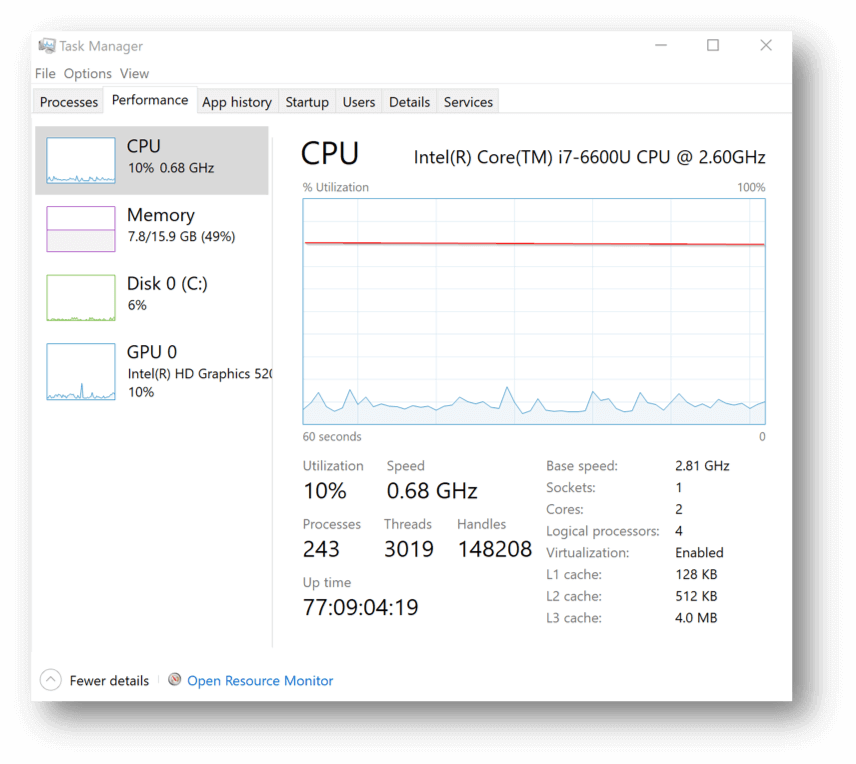
Performance issues related to CPU-based constraints are the most common and easiest to identify. All you need to do is observe the Windows Task Manager while the problem is occurring. The Performance tab will clearly show you if CPU utilization (as a percentage of total) is high or low. If you’re seeing total CPU constantly spiking or flatlining at 75% or more, you’re likely CPU constrained.
High CPU utilization may be the result of some other issue that’s causing CPU usage to be high. For instance, if free RAM is low and the OS starts paging RAM contents to disk, this will spike CPU and disk activity — but the root cause of the problem will be RAM exhaustion, not CPU usage. Therefore, it is important to understand precisely what is causing high CPU usage and why.
CPU usage is typically measured in % CPU utilization of total CPU capacity available. This is important, because it is nothing more than the ratio between “how much CPU is being used” divided by “how much CPU is available”. This means that the usage can be high as a result of high CPU demand by users (e.g. watching YouTube) and applications or low amounts of available CPU (e.g. under-provisioned VM) – or both. Therefore, the resolution to a CPU-based performance constraint is simple: reduce demand on CPU and/or increase the amount of available CPU.
Understanding how much CPU is available is easy. Just look at the Task Manager performance tab to see how many cores or logical processors there are in your VM.
Understanding what is consuming the CPU and how much is being consumed can be done by looking at the Task Manager details tab and sorting the list of processes according to the CPU column in descending order. You can also add the “CPU Time” column to see which process has been consuming a lot of CPU in aggregate over time since the VM booted up.
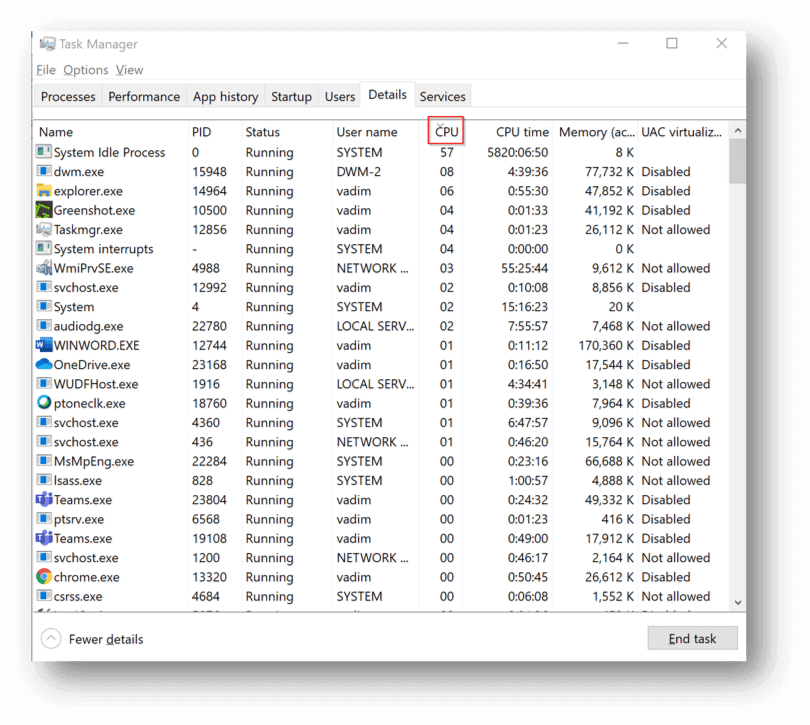
What you’re looking for here is unusually high usage patterns for a single or handful of processes that are not expected. If a process (other than System Idle Process) is at the top of the list most of the time, you need to determine whether that’s expected or the process is having an issue and may need to be killed. If CPU utilization is high but the list of processes looks normal, with each process consuming a fraction of the CPU capacity, then it’s likely that the actual, legitimate load placed on the VM exceeds its available CPU.
How CPU contention manifests itself to the end-user
- “Not responding” applications
- Slow log on and log off
- Slow launching of new applications, opening, and saving files
- Slow switching between windows
- Spinning (loading) cursor
- Web page loading slowly
- Pegged CPU can sometimes mimic network performance issues (audio distortion, slow screen refreshes) when the agent can’t keep up
Check out our video overview below and/or read more about steps to resolve CPU-related issues.
AVD Environments: Practical steps to troubleshoot and resolve CPU related issues
- Connect to session host VM and look on performance tab of Task Manager. If CPU is consistently low or moderate, then move your troubleshooting on to another system component.
- If CPU is spiking high and frequently or staying near the top consistently, determine if this is normal behavior or if something unusual is happening. Check the details tab in Task Manager and look for any processes at the top of the sorted list that aren’t expected to be there.
- If there is an offending process at the top of list, investigate what it is, what user it is running under, and why it is keeping the CPU so busy. Terminate the process if appropriate or take steps to optimize it depending on what it is.
- If all processes are as expected and none are using an excessive amount of CPU constantly, then add more capacity or decrease load to improve performance.
- To increase capacity, increase the size of the VM
- To decrease CPU load, spread users out across more session hosts
- In most scenarios, AVD session hosts are CPU-bound, meaning that you will run out of CPU capacity before running out of RAM capacity. The most common VM families are Ds-series (v3 and v2) and Es-series.
- Here are some common mistakes that we often see lead to CPU-related performance issues
- Using burstable (B-series) VMs for production workloads. These VMs may look like they have decent amount of CPU, but they have associated CPU quotas that limit how much of that CPU can be used. Don’t use B-series VMs as session hosts in production (learn more about B-series VMs in the Nerdio Academy).
- Leaving unnecessary start-up items that launch with every user login and needlessly consume CPU. The more users log in, the more processes start up and the more CPU is wasted. Check the All Users StartUp folder (C:\ProgramData\Microsoft\Windows\Start Menu\Programs\StartUp) for any items that don’t belong. This should typically be an empty folder in a AVD deployment.
- When deploying AVD session hosts from an image, updates may be installing every time a session host is deployed. This happens when Windows Update was run on the template VM but the update didn’t finish installing. Creating an image and then deploying session hosts from this image will install these updates (very CPU-intensive process). Be sure that updates are fully installed on the template VM before capturing it as an image. Allow the template VM to stay on for a long time and watch the CPU graph in Task Manager. Once all CPU activity dies down, capture the image.
- Streaming services like Pandora, Spotify, and YouTube consume a ton of CPU on virtual desktops rendering and encoding media. These offenders can be easily seen in Task Manager during performance issues and will be at the top of the list. Educate your users to stream on their local devices and not on the virtual desktop. This will increase performance for others and reduce your bandwidth costs.
2. AVD Environments: RAM-Related Performance Constraints
On Azure Virtual Desktop (AVD) session hosts, RAM is primarily consumed by applications that run within users’ sessions. Modern applications use a lot of RAM. Each Google Chrome tab, open Word document, Outlook, Teams, and other apps can consume tens or even hundreds of MBs of RAM. With multiple users sharing a session host VM, this usage can add up quickly and consume all available RAM.
High memory usage in it of itself is not an issue. An application loading its bits into RAM will run faster than having to fetch data from a much slower disk. However, when too many applications load too much of their data into RAM, then hard faults (previously known as page faults) start to slow down the VM.
A hard fault happens when a memory page that an application expects to find in RAM is unavailable and the page has been moved to the pagefile on disk. This causes the operating system to go to disk to retrieve this data, which takes orders of magnitude more time than fetching it from RAM. Consistently high page faults are an indication that the system is starved for available RAM. Simply high RAM usage (used RAM as % of total available) is not a problem on its own but it is usually an indication that hard page faults are likely.
Diagnosing RAM-related performance issues can be done using Windows Resource Monitor. This tool can be launched from the performance tab of Task Manager or by running “resmon” from the Run dialog box. Looking at memory usage in the Task Manager will tell you the amount of RAM used but won’t tell you anything about hard faults.
In the Resource Monitor>Memory tab you want to focus on the Hard Faults/sec counter first. If you’re seeing little or no activity there the system is likely not RAM constrained at the moment. Bursts or constant hard fault activity is an indication of a performance issue.
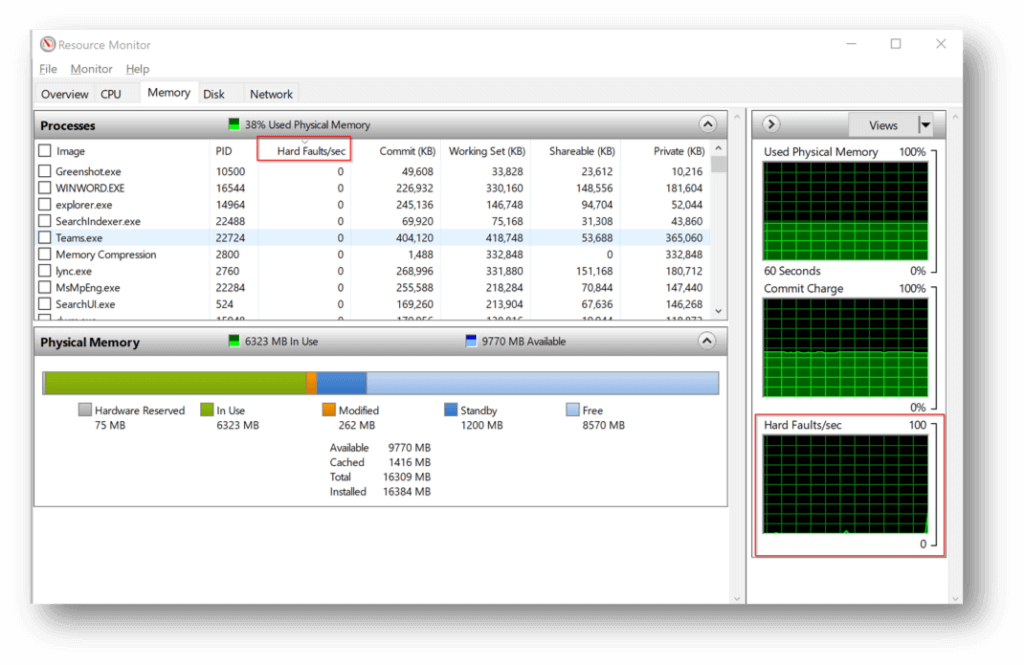
If there are hard faults, then sort the running processes by the “Hard faults/sec” column and look for the ones contributing most to the performance issue.
RAM-related performance issues can result from too many users and applications, a single process hogging an unreasonable amount of RAM, or a faulty application that doesn’t release the RAM even when it’s not using it.
How RAM contention manifests itself to the end-user
- “Not responding” applications
- Slow log on and log off
- Slow launching of new applications
- Slow switching between windows
- Already-running applications slow, jittery. Idle applications slow to resume.
- Unexpected app crashes
- Windows errors for low virtual memory
Check out our video overview below and/or read more about steps to resolve RAM-related issues.
What to do about RAM-related performance issues?
- If high memory usage is the result of normal user and application load on the VM then the only thing to do is upgrade the VM size to one with more RAM or spread users out over more session host VMs. The most cost effective first step is to upgrade from a general purpose VM size (e.g. Dsv3) to a memory optimized VM size (e.g. Esv3). The memory optimized instances double the amount of available RAM while keeping the number of CPU cores constant and only increase the VM price by approximately 15%.
- If high memory usage is the result of a faulty process or application, close that process or sign out the user. It is a good idea to educate users to log off their desktop session at the end of the day or put in place automation policies that will automatically log users off after a certain period of inactivity.
- Applications that cause memory leaks can pose a challenge when session hosts stay on for long periods of time. Scheduling VMs to restart on a regular basis (e.g. nightly) or using autoscaling can prevent such problems by clearing the memory on a regular basis.
3. AVD Environments: DISK-Related Performance Constraints
So far, we’ve covered how to troubleshoot AVD performance for CPU and RAM. Troubleshooting disk performance is a bit more challenging, however. Slow disk response and long disk queues can have significant performance impact on end-user experience.
For AVD session hosts, two disks are important: the local disk on session host VM and FSLogix profile container:
- Session host VM local disk is where system temporary files are written and where application binaries are launched from. Slow disk performance will reduce the overall responsiveness of the user’s desktop session especially when it comes to launching applications and starting up the VM. Virtual desktop VMs have a unique disk I/O profile and can benefit from faster storage such as Ephemeral OS disks in Azure.
- FSLogix Profile Containers are VHD files mounted over the network and stored on a file server outside of the session host VM. These virtual disks are where user temp files, indexing, and user data are written to. The performance of the underlying FSLogix storage system and the network that connects the session host VM to that storage has significant impact on user performance.
Resource Monitor is a useful tool to diagnose disk problems. The Disk tab shows the per-volume Disk Queue Length. A high queue length value (constantly over 1 and certainly spiking to the teens) is a good indication that the operating system is spending a lot of time waiting for the disk to respond to requests and the queue is long. A consistently low disk queue length (<1) is a good indication that disk is likely not the constraint.
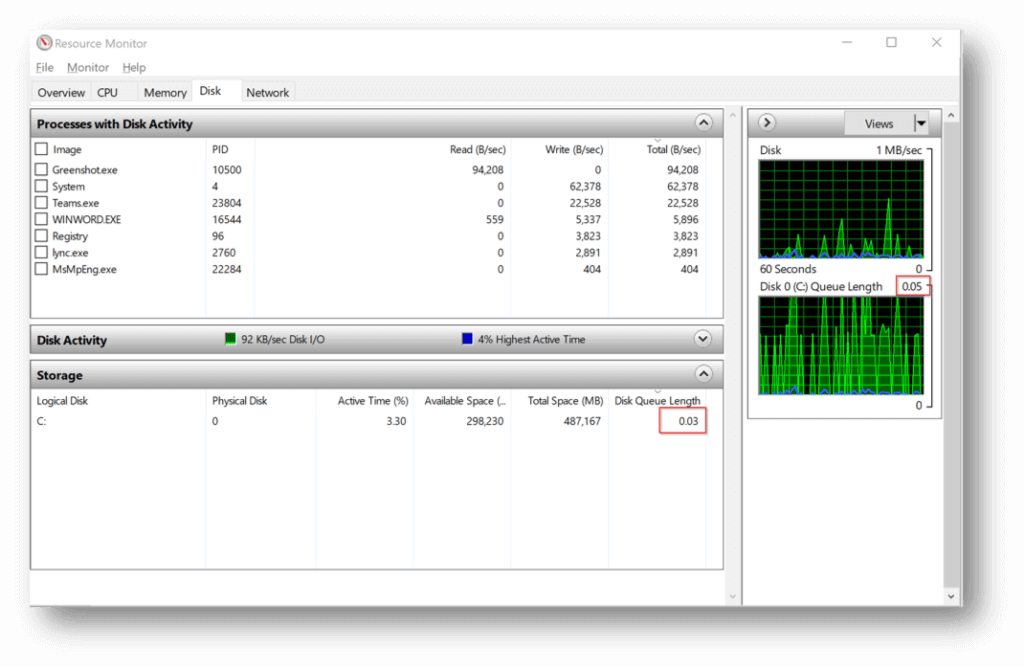
Keep in mind that looking at Disk Queue Length metric on the session host tells you how well the local disk is performing but doesn’t tell you how well the FSLogix VHD disk is performing. Therefore, you need to run Resource Monitor on both the session host VM and the file server hosting the FSLogix containers.
If disk queue length is high, then there is likely high activity being generated by some processes running on the system. Expanding the Disk Activity section on the disk tab of Resource Monitor will show you what process is using which file on disk. This can be helpful in narrowing down who or what is generating so much disk activity that disk queue length is high.
In Azure, each managed disk size has performance limitations and so does each VM size. Selecting a VM for FSLogix file server (e.g. FS01) that’s too small can lead to poor user performance even when using the fast Premium SSD disks. In the chart below you can see the currently available Premium SSD managed disks with the corresponding IOPS and throughput limits. The performance limitations increase (vertically) with disk size and a single VM can have multiple disks to horizontally scale performance limitations. For instance, two P10 disks will allow for 500 IOPS each so if a Windows volume is created to span both of them then the new effective IOPS limit on this volume will be roughly 1000 IOPS.
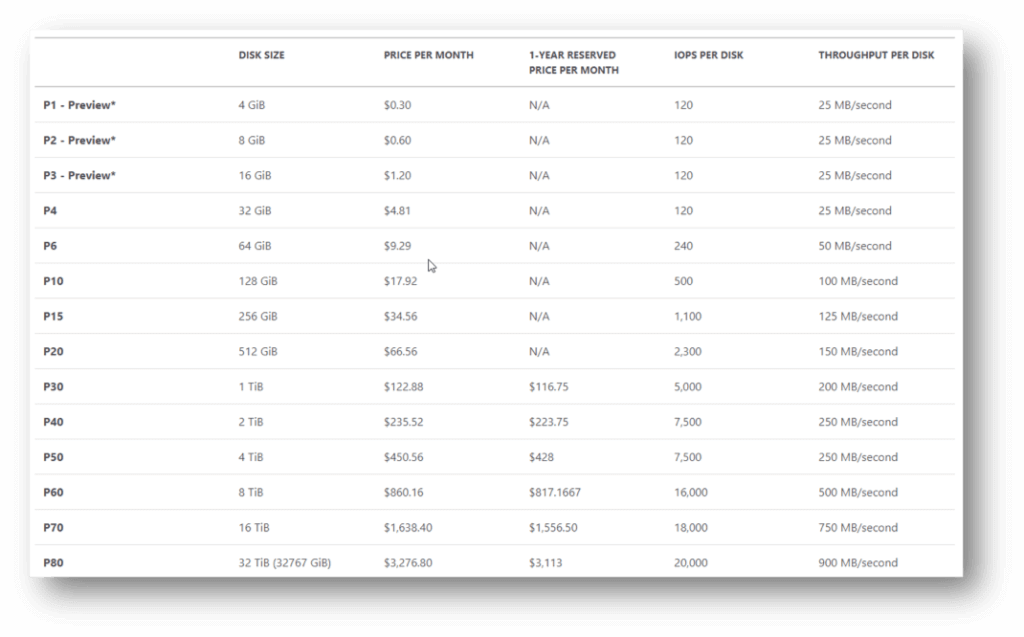
Even with the fastest, largest managed disks, storage performance may still suffer if the VM to which these disks are connected is undersized. Each VM family and size has its own set of parameters and performance limitations, include storage IOPS and throughput. For example, general purpose VM information can be found here. An example of the Dsv3 series is below.
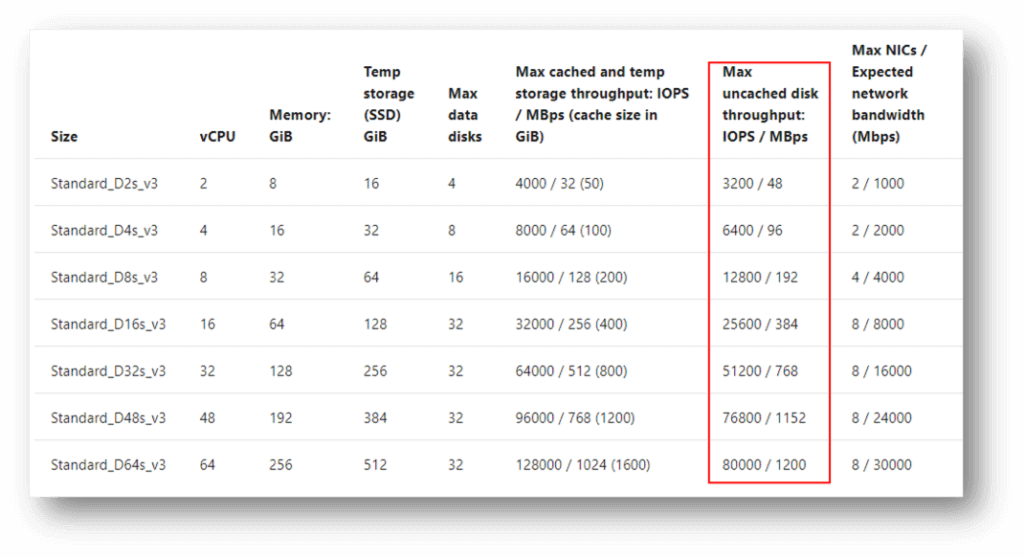
If the file server VM that’s storing FSLogix profiles is a D2sv3 with a P40 (2TB) Premium SSD managed disk then the throughput will be limited to 48MBps (instead of 250MBps allowed by the disk) and IOPS will be limited to 3200 (instead of 7500 allowed by the disk).
How DISK contention manifests itself the end-user
- Slow log on and log off
- “Not responding” applications
- Slow launching of new applications, especially apps with large cache or temp files (e.g. browsers)
- Slow switching between windows
- Slow to open & save files
- RAM bottlenecks can impact disk through page faults
Check out our video overview below and/or read more about steps to resolve disk-related issues.
What do to about DISK-related performance issues?
- Make sure your file server VM is not undersized and both it and the managed disks that are attached to it have sufficient throughput and IOPS capabilities to support the number of users in the deployment.
- Do not use Standard HDD storage (S-disks) for session hosts OS or FSLogix storage. At a minimum use Standard SSD (E-type) disks.
- Consider using Ephemeral OS disks for session host VMs.
- Use Premium SSD (P-type) disks for file servers where FSLogix profiles are stored. Other storage types will almost certainly reduce user performance.
- Roam users’ indexed search cache data by storing it in the FSLogix container. Otherwise, every time a user logs in, their index will be rebuilt and cause excessive disk I/O.
- Store users’ cached Outlook data (OST file) in the FSLogix container. Expect high disk IO when users log in for the first time and start using Outlook. While the OST file is being hydrated with newly downloaded data, disk IO will be high. If many users are logging in for the first time at the same time, overall performance will suffer. Plan for this to happen during the go-live and try to stage users in groups rather have them logging in all at once.
- Streaming activity (e.g. Spotify) can produce a lot of FSLogix VHD I/O. Learn how to spot a single user’s VHD file on the file server being very active (using Resource Monitor) and educate users to do their streaming locally.
- Consider scalability of disk I/O in large environments.
- The larger the Premium SSD P-disk is, the more I/O and throughput it can tolerate.
- Multiple P-disks can be attached to a VM and a Windows volume can be created across them. This allows for I/O to be spread across multiple disks.
- Scale Out File Server can spread the I/O across multiple file server VMs with one or more disks attached to each.
- Azure Files on Premium Storage are a fast storage option.
- NetApp Files are a high-performance option.
- Ultra-SSD (U-type) disks are also very fast.
4. AVD Environments: Network-Related Performance Constraints
Network latency and packet loss can create a poor end-user experience. Bandwidth, on its own, is not a likely contributor to poor performance unless the bandwidth is very constrained and that leads to latency of packet loss. It is very important to draw the distinction between bandwidth, latency, and packet loss. They are different, and often independent, measures of network quality and troubleshooting one when the problem is with another can lead to lots of wasted effort and erroneous conclusions.
We often see bandwidth tests (e.g., speedtest.net) being used to rule out the network as the cause of slowness and this is a big and common mistake. A speed test tells you how much bandwidth there is at a point in time, but it says nothing about the latency and packet loss of the connection between the end-user device and the virtual desktop in Azure.
Let’s define some terms first:
- 1. Bandwidth is the “capacity” of a connection (also known as throughput). It answers the question of “how much data can be pushed through this connection in a given unit of time”. It is typically measured in Mbps (megabits per second). The easiest analogy to understand bandwidth is to think of a water pipe, where the water is data and the diameter of the pipe is bandwidth. The “thicker” the pipe, the more water can be pushed through it over a given period of time. The more bandwidth a network “pipe” has, the more data can be pushed through it.
- Effective, end-to-end bandwidth is determined by the “thinnest” segment of the connection. This means that when the data travels from the end-user to the Azure VM over multiple networks (e.g. user’s home wifi, cable router, internet backbone, AVD management service, Azure vNet, etc.), the connection segment that has the lowest bandwidth will determine the overall end-to-end bandwidth.
- Bandwidth between two network nodes can be measured by pushing as much data as the pipe will tolerate for a period of time and then measuring how much was actually transferred. This is how speedtest.net (and other such tools) work. They try to download and upload as much data as they can in a preset amount of time and then calculate the bandwidth. It is important to note that a bandwidth test measures bandwidth between two network nodes: user’s device and some internet hosted speed test server. There are other, more sophisticated ways, to measure actual bandwidth between two network nodes. A popular tool that is often used is iperf. When using iperf you must be sure to saturate the network, which won’t always happen with the default settings. Settings like TCP window size and concurrent threads need to be tweaked to saturate the connection and get a true measure of network throughput.
- 2. Latency is the length of time that it takes data to reach from one end of the connection to the other (e.g. from the end-user’s device to the Azure VM). In our water pipe analogy, it is the length of the pipe. The base latency of a network connection is determined by the physical distance that this connection spans. The latency of a connection between two points that are far away from each other will be higher than that of two network nodes that are physically close to each other – all else being equal. Network latency is typically measured in ms (milliseconds).
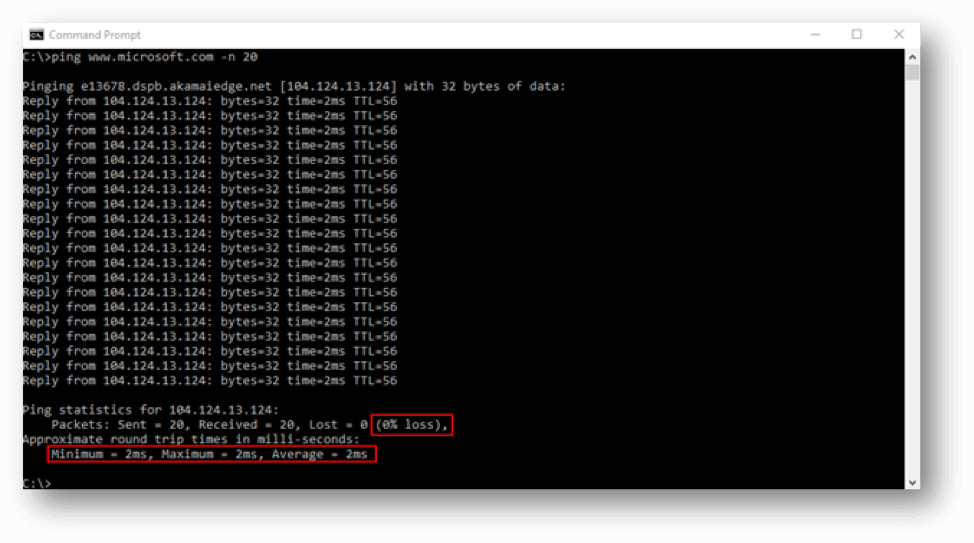
- Latency can be easily measured by simple tools like “ping”. The time value returned by the ping command is the round-trip time that it took a data packet to make it from source to destination and back from destination to source. For a decent virtual desktop experience, the round-trip latency should less than 100ms. Between 100ms and 200ms is still ok, but anything above 200ms is going to be noticeable by the end-user.
- The base latency is determined by physical distance of the connection, but other factors can contribute to high latency. For instance, if the routers responsible for routing the data packets along the way are busy then latency will increase. If they are very busy, it will increase a lot. End-user experience is very latency sensitive. Increased latency will be immediately noticed by the end-user. They will notice slowness of screen refreshes, delay in typed characters appearing on the screen, and slow response to mouse clicks.
- Lack of bandwidth can contribute to high latency. Imagine our water pipe being filled with water. A drop of water will take longer to get from one end to the other because the pipe is full. The same happens when the bandwidth is limited, and the amount of data being pushed through the network connection exceeds its throughput capacity. This will cause latency to spike and user performance to plummet. For example, if a user is streaming a full screen HD video on their virtual desktop and saturating the network connection with that traffic, typing is going to be “laggy”.
- 3. Packet loss is the % of data packets that get dropped or lost along the way and never make it from the source to the destination. It is the biggest user performance killer. Packet loss happens when routing infrastructure along the way of the data packet gets very busy and drops the packet or as a result of poor line quality. For instance, if a user has a cable internet connection and the quality of the signal from the cable company to the user’s cable model is poor this can manifest itself as packet loss.
- Packet loss will cause “laggy” typing performance, slow screen refreshes, and overall “sticking” for the user. This is because commands that are sent by the user to the virtual desktop aren’t making it there in a timely fashion.
- The TCP network protocol is designed to acknowledge that data has been received and if not, it is retransmitted. High levels of TCP retransmits could be the result of packet loss. UDP traffic is not acknowledged and if it’s dropped it never gets resent. High-performance desktop streaming protocols (e.g. RDP v10) are designed to leverage UDP for screen streaming.
- Packet loss can also result from line saturation, just like high latency. If more traffic is being pushed through the line than it can support, then not only will latency go up, but packet loss can also result.
- The easiest way to test for packet loss is to use the ping command. A reply indicates that the ICMP packet made it all the way there and back and a Request Timed Out indicates packet loss. At the end of the ping command there is a summary with a percentage of loss.
So, how does all of this apply to Azure & Azure Virtual Desktop?
There are three network segments to be aware of when troubleshooting AVD user performance:
- User’s device –> AVD Management Service (connection broker) hosted by Microsoft in various regions. The host name that the user connects to is rdweb.avd.microsoft.com and gets routed to the closest connection broker based on user’s location.
- AVD Management Service (connection broker) –> user’s Azure desktop VM. This happens via “reverse connect” that is initiated by the AVD agent installed on the desktop VM.
- Azure desktop VM’s –> public internet. This is what you’d measure by running a speedtest.net
Connection segment #1 and #2 are primarily responsible for a user’s experience. Connection segment #3 isn’t. Unfortunately, most tend to run a speed test on their local device and virtual desktop and use those data points as a baseline for troubleshooting connectivity. However, by understanding bandwidth, latency, and packet loss and the three connection segments involved in connectivity to a virtual desktop we can see how these data points are of little value.
How NETWORK contention manifests itself to the end-user
- Slow screen refresh (or painting)
- Delayed typing and cursor
- Jittery mouse
- Bursts of letters appearing while typing
- Audio degraded or distorted
- Screen goes blank, then reappears
- Fonts fuzzy, overall image becomes less sharp (focused)
- Aero Shake triggering while dragging windows
Check out our video overview below and/or read more about steps to resolve network-related issues.
What to do about it
- From a probability standpoint, it is much more likely that the issue is with segment #1 than #2 or #3.
- Measure bandwidth of the local connection by running a speed test
- If the bandwidth is decent, check for latency and packet loss by running a continuous ping for a few minutes. This requires pinging a host that responds to ICMP pings. Unfortunately, AVD connection brokers do not. However, you can ping www.microsoft.com. High or “spikey” latency and even occasional packet loss will contribute to poor user connectivity.
- Remember that latency and packet loss issues can be sporadic. Meaning, when you run the test, things look good, but the user still reports that there are problems. It is important to run the tests while the user is experiencing the problem. Tools like PingPlotter can be very helpful in doing this in the background and then correlating the problem with user reports.
- Troubleshooting local connectivity is the only resolution to segment #1 problems.
- If you can identify that the problem is in segment #2, although this would be difficult to do, then a support case with Microsoft should be opened. There is nothing you can do to resolve this problem on your own.
- If connectivity from the Azure VM to the public internet is the problem (segment #3) then there are a few things you can try before opening a case with Microsoft.
- Stop (deallocate) the VM and start it again. This may move it to another physical host in Azure that may improve network connectivity.
- Redeploy the VM from the Azure portal to have it forcefully move to another physical host in Azure.
- Check Azure health status page to see if there are any current service impairment incidents that could be affecting your VMs.
- Try running a speed test from another VM on the same network. If the problem is not present on the second VM, then investigate CPU, RAM, and DISK as potential root causes.
- Temporarily disable any software firewalls or AV solutions running on the desktop VM and see if that makes a difference.
- If none of this helps, open a ticket with Azure support.
How much bandwidth is really needed for virtual desktops?
Maxing out available bandwidth usually generates symptoms that match most other networking issues, probably because most networking issues in the public internet are caused by lack of bandwidth or changes in traffic flows that cause momentary bottlenecks while routes converge. Users would typically perceive this as slow screen refreshes, screens going out of focus (or taking a while to sharpen), screens going blank (depending on bandwidth bottleneck severity), and definitely audio distortions. This is also accompanied with very slow jittery mouse and keyboard activity.
While troubleshooting this type of an issue you would typically see high ping times (typically not timeouts or drops, unless it’s extremely bad), and usually traceroute can identify the bottleneck point – usually first or second hop from the end-user location would be the problem point if their office bandwidth is exhausted. Topping out available bandwidth with virtual desktops would reflect symptoms creeping up slowly, with occasional bursts causing the worst symptoms. If users are experiencing long periods of issues, it’s usually things like downloads and uploads consuming bandwidth for extended periods of time – virtual desktop network traffic usually comes in spurts with activity on the screen. Unless the users have sustained activity on the screen, the symptoms from maxing out bandwidth would pop up frequently and then disappear.
The typical average bandwidth consumption we see is roughly 0.5Mbps per active user, with more active users bumping that up to roughly 2Mbps/user. That’s just an estimate based on averages – users with extremely active screens (multimedia or applications with constantly changing visuals) can peak as high as 50Mbps (you read that right!). That’s definitely the high end, but users watching full screen videos could easily push 15-20Mbps each – imagine a team of employees participating in a full-screen video webinar or watching training videos, 10 users at 10Mbps apiece would saturate a 100Mbps link. Keeping these rough guidelines in mind will help you properly size the network connectivity required to support a good experience for your virtual desktop users.
Conclusion
Good performance is critical for a successful desktop virtualization deployment. End-users will reject their new virtual desktops if poor performance impedes their productivity. Troubleshooting AVD performance is similar in some respects to traditional desktop performance troubleshooting but is much more complex and requires an understanding of all system components. A methodical, diligent approach to identifying the root cause of the problem is needed and this guide provides the building blocks and tips for going through such a process.
At Nerdio, thousands of virtual desktop environments have been deployed on our platform and we help hundreds of partners deliver high-quality, high-performance virtual desktop environments to their customers.